

How to prepare an income statement with Power BI ?
The increasing usage of Power BI to draft an income statement constitutes a major turning point for accounting and finance professionals. The challenge for the latter consists to use the accounting data to draw meaningful insights. In the era of Big Data, processing large volumes of data has become more mainstream. Power BI is helping to reinforce this trend.
Moving from Excel to Power BI
However, to prepare financial analysis for decision-makers, Excel remains the most widely used tool nowadays. But, from the perspective of transforming large datasets (as with the FEC, the French consolidated file of accounting entries mandatory in case of a tax audit), Excel’s limitations are numerous and significant :
- 1 million lines maximum
- Manual and repetitive tasks
- Obligation to learn VBA to automate some processes
- Risk of errors
- Duplication of work and data
- Etc
Power BI allows these limitations to be overcome by writing queries. These can simply be refreshed each time the dataset is updated. Not to mention the advanced functions for data visualisation and report sharing that are not included in Excel. Below are some of the best practices to build a Power BI income statement using large datasets such as the FEC.
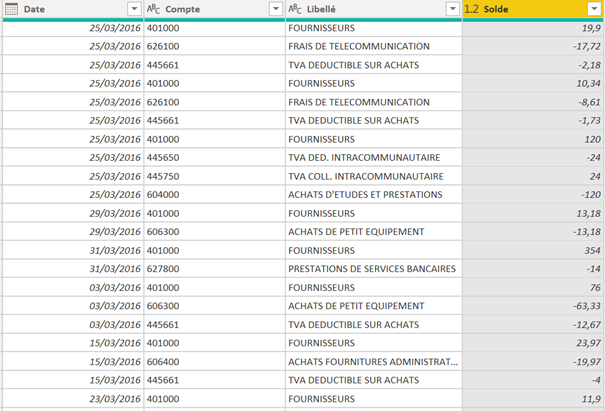
Step 1 : transform the data
The first step is to import and transform the data. The goal here is to present the data in the form of tables containing as few columns as possible. If in Excel, we tend to present the data in columns in a single table to use the pivot tables and the VLOOKUP function, the approach must be quite different in Power BI. Indeed, the separation of data into fact tables (accounting daily transactions) and dimension tables (axes of analysis) will optimize the data model. In practice, this will consist of “wrangling” the data so as to keep only the rows and columns essential for the analysis.
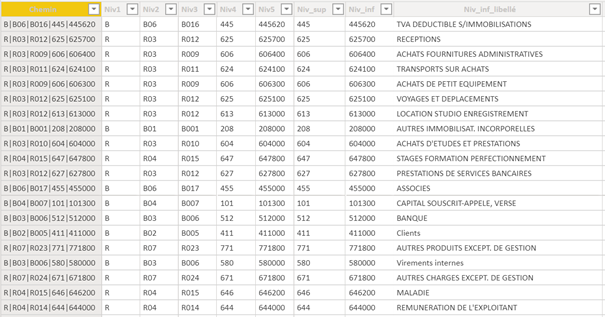
Step 2 : build the dimension tables
Then, the task will consist in building a table of dimensions containing the hierarchy of statutory accounts. This step will allow to display the different sections of the financial statements in the appropriate order. Several methods are possible for this. A first method is to add an index column and sort the labels by this column. Which will display the labels in the correct order. This method, if simple, can however quickly reveal its limits when the labels are numerous. Another more advanced and robust method for exploiting large sets of data is to take advantage of the parent / child DAX functions to build the desired hierarchy. On this subject, you can refer to the article written by Marco Russo which explains in detail the use of these functions.
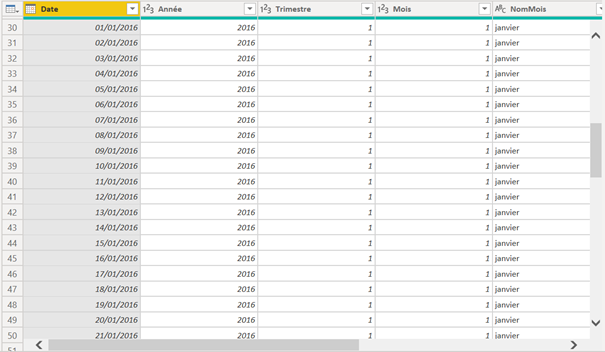
Then, in order to harness the full power of Power BI time intelligence functions, you will need to build a separate date table. We can do this either in the data view with the DAX functions, or in Power Query using the M language.
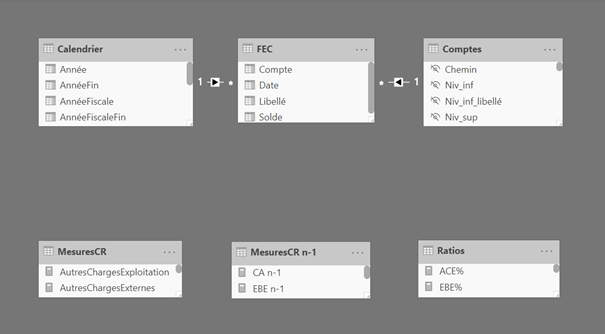
Step 3 : link the tables together and build the visualizations
Once the tables constructed, simply link them together in the data model, then write the appropriate measures to calculate the main items of the income statement.
Once the model finished, you can unleash your creativity to draft the most impactful visualizations for your dashboard !
In a nutshell, while building a detailed income statement is far from simple, the task remains feasible under Power BI. Do not hesitate to contact us you need support in producing dashboards from your accounting data !