

Power BI and calculated groups
Why use calculated groups in Power BI ?
In Power BI, calculation groups are a new feature that allows you to aggregate many measures into one generic measure. This saves a lot of time because the calculation groups save the Power BI user from writing the same measures for each metric they want to analyze. For example, in accounting and finance, it is very tedious for each KPI (sales, costs, margin) to write a measure for the :
- Amount of the current year
- Amount for the previous year
- Variation vs PY in value
- Variation vs PY in percentage
As long as there are a large number of KPIs to track, the Power BI model can quickly contain hundreds of measures. Even though there are features to store the measures in an organized manner, maintaining such a model remains difficult in the long run. In addition, writing measures for each KPI is a repetitive task with low added value. Because it does not require advanced DAX functions. Indeed, the metrics analyzed in accounting and finance generally involves balances, variations and YTD at different periods. For this, the functions of Time Intelligence are widely used.
So, to continue with the previous example, instead of writing 4 different measures, it is more convenient to write a single “Time Intelligence” measure. This allows all the information to be viewed in a matrix.
To convince you of using calculated groups in Power BI, there are many articles to read on SQLBI.
An example of how to implement calculation groups
The prerequisites
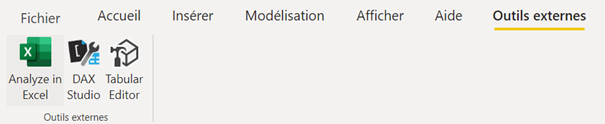
Before showing you an example, you must first download and install Tabular Editor. This tool offers features for managing the Power BI model, and above all allows you to write calculation groups. This is because calculation groups are not currently available in the native Power BI interface. Hence the need to download and install the add-in. After installing Tabular Editor, you should see the icon appear in external tools :
By clicking on it, you should see an interface similar to the one shown below :
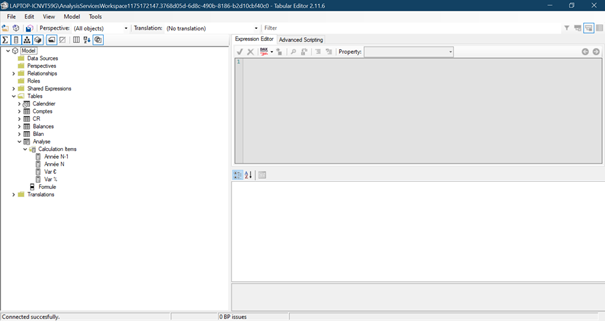
From the interface above, you can write the DAX measures that you will use to implement the calculation groups.
How to use calculated groups to display a more detailed P&L
Regarding the more detailed description of the features of Tabular Editor and writing calculation groups in DAX, we refer you to this video which explains very well how to do this.
By applying the advice contained in the video, you can, for example, view all the columns necessary for your income statement analysis. And this, by dragging only one measure in your matrix instead of 4 :
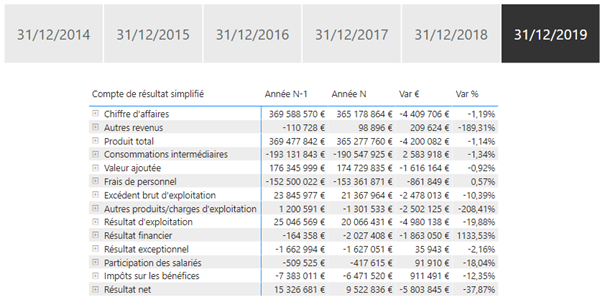
Of course, you can add as many calculations as you want in your calculation group (year N-2, YTD, moving average, etc.). There will always be only one measure to drag to show all of your calculations.
Concerning the construction of an income statement in Power BI, we refer you to our previous article which will give you some tips on the subject. In this regard, we will simply recall that it is relevant to implement data mining functionalities in the model. In fact, the user will be able to view the details of the income and cost items by clicking on the “+” icon next to each item in the income statement. To do this, the designer of the model can build hierarchy tables detailing the items in the income statement. And possibly resort to the parent / child functions in DAX if necessary.
In summary, calculated groups are a very powerful new feature. This will significantly reduce the number of measures to write and maintain. This will free a significant amount of time for more valuable tasks.