

Business Intelligence
Financial dashboards
Unleash the hidden power lying inside your financial data and improve the performance of your business !
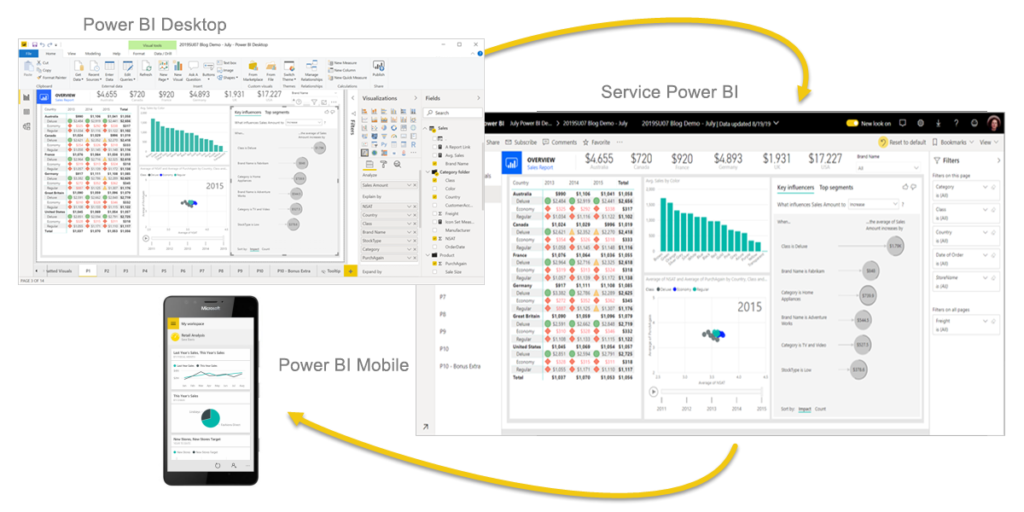
We put our skills at your disposal to create dashboards from your financial and management accounting data. Choose the most relevant performance indicators (KPIs), and we will integrate them into your dashboard. For this, we rely on Power BI, which embeds a bundle of software, applications and connectors that transforms, visualizes and analyzes data. With Power BI, monitor your key indicators in real-time with a single click, whether on your desktop computer or on your smartphone

Our methodology is structured around the following 3 stages:
- Definition of project outlines and objectives : we will carry out an initial interview in your premises in order to specify your needs, understand your internal organization and present our approach. After this first meeting, we can tell you which indicators can be integrated into Power BI based on the data available in your information system.
- Choice of indicators : from the initial scoping of the mission, we will build the data model and select the most relevant indicators to highlight. We will also validate the account hierarchy used in order to present financial statements adapted to your specific activity.
- Presentation of the dashboard : we will present the finalized dashboard, as well as its operating instructions. Of course, this tool will be fully customizable and scalable according to your needs. We can assist you in updating the tool, as well as in analyzing the indicators from the dashboard. We will also provide you training sessions if needed, so as to allow you to be more autonomous with Power BI.
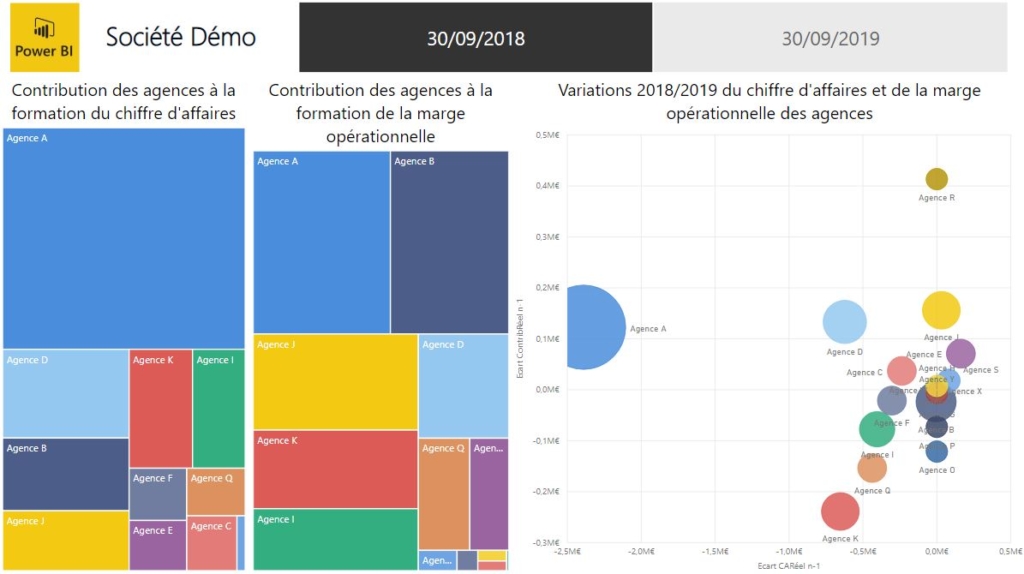
Don’t leave your data unexploited! Exploit the full potential of your accounting data from journal entries, general ledgers, trial balances, etc. Make your Excel reports become game changers by bringing them the dynamic and interactive nature of Power BI! Take advantage of powerful and stunning visualizations to convince your audience and improve your decision-making abilities!
HR Dashboards
Social data is full of very useful informations for the entrepreneur, but these are most often unexploited :
- Nominative social declarations (DSN)
- Payroll extractions
- Headcount files
- HR reporting done manually in Excel
Consequently, we offer to build HR dashboards for you, in order to help you manage your workforce and your payroll. Like financial dashboards, we will also use Power BI to provide you with the most relevant indicators in an interactive and dynamic way.

To achieve this, we implement our same methodology in 3 stages:
- Definition of needs and objectives
- Construction of the data model and choice of social indicators
- Presentation of the final dashboard
Thanks to this approach, we are able to deal with a non-exhaustive list of Power BI use cases:
- Periodic monitoring of staff by type of contract, status, job, site, age, seniority, etc.
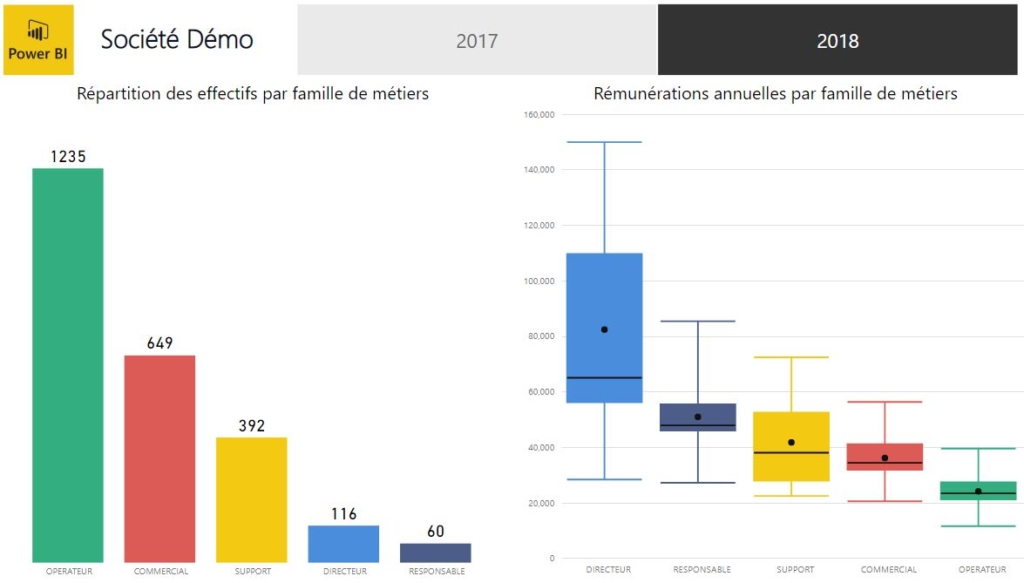
- Analysis of compensation policies according to relevant criteria, using statistical functions (average, median, min, max, standard deviation, etc.)
- HR database for the workers’ council
Do not hesitate to contact us to submit other topics that you want to deal with Power BI !
French Desk
Need to open a French subsidiary to expand your business? Our French Desk will assist you in all the legal, accounting, tax and HR matters. Therefore, you will be able to get a head start in France.
Beyond these formal aspects, our firm will help you to understand the French market and to take advantage of it. Our multicultural orientation will be a major asset to prevent misunderstandings with your French counterparts.


Why settle your business in France?
- Strategic anchoring point within the European continent. France is a particularly suitable place to establish and develop your business in Europe. This central place will allow you to reach 500 million European consumers.
- You will also benefit from French favorable tax schemes for entrepreneurs and start-ups. These include the research tax credit, as well as grants and subsidies for young innovative companies. These schemes enable France to report the lowest effective tax rate on European Union R&D profits.
- The French skilled workforce will give you an clear advantage in a global market. Indeed, FRance dedicates 7% of its GDP to education and training. Thus, France is ranked 7th worldwide in terms of hourly labor productivity, ahead of the United Kingdom and Germany.
- Last but not least, the French quality of life will offer you the ideal environment to develop your activities.
Leave us your contact information here and get started in developing your operations with our French Desk !